At FBS, we use Sidekiq for background processing including some high-volume tasks like email delivery. This winter, we’ve been focusing some time on infrastructure updates including a jump from Sidekiq 3 to 4. Mike Perham made some incredible improvments for the 4.0 release. In particular, we were excited about the removal of several major dependencies. Unfortunately, as soon as our change hit production, we experienced a major spike in memory use:
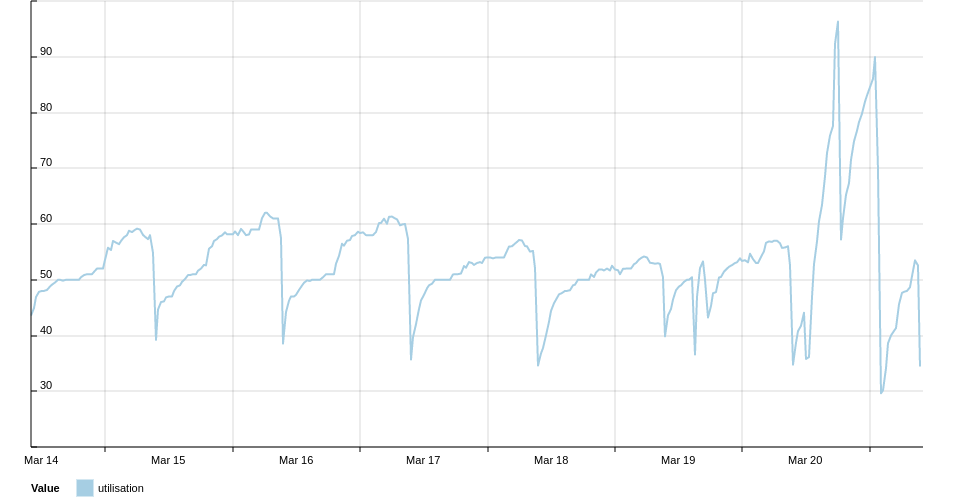
This graph shows overall system memory utilization on one of our worker nodes. The first 6 days show very consistent growth after process restarts, but the right side of the graph shows a jump from roughly 60% utilization at peak to nearly 100% starting shortly after the deploy. We rolled the change back in production and went to work trying to pin down what was happening.
Choose Your Own Adventure
We started with the assumption that this wasn’t a Sidekiq bug. Scores of other organizations use the same software at much higher loads than us and any memory leak this substantial in Sidekiq itself is almost certain to have been caught and fixed long before we upgraded.
The next decision to make was whether we thought this was a leak or something else. Making an educated guess about the problem domain can help us decide our next steps. We’re seeing a lot of memory allocated, so we could be experiencing a memory leak where memory allocated grows, usually linearly over time. We could also be seeing a large jump in objects being allocated somewhere in our code. And lastly, this could be the result of heap fragmentation, where we’ve allocated a lot of objects that are garbage collected, but the VM has a hard time making use of the empty space from objects that are freed.
Now we have some decisions to make. Ruby has tools like
memory_profiler, allocation_tracer
and even the built-in ObjectSpace module that can help us
hunt down memory leaks, but this type of work can be very time consuming, it
wasn’t where we preferred to start.
Skimming the code in search of inefficient ActiveRecord queries would be much less time consuming since we don’t use a lot of ActiveRecord queries in our workers and didn’t have a large number of classes to review, but I remembered seeing something on the Sidekiq wiki about memory, and I wanted to go back and read what that was before I did anything else.
RTFM
This is one of those cases where actually reading the manual payed dividends. The section dedicated an entire section on the wiki to it touches on inefficient ActiveRecord patterns–which helps validate we’re thinking about the right type of thing as the source of our problem–and then includes this little note about heap fragmentation:
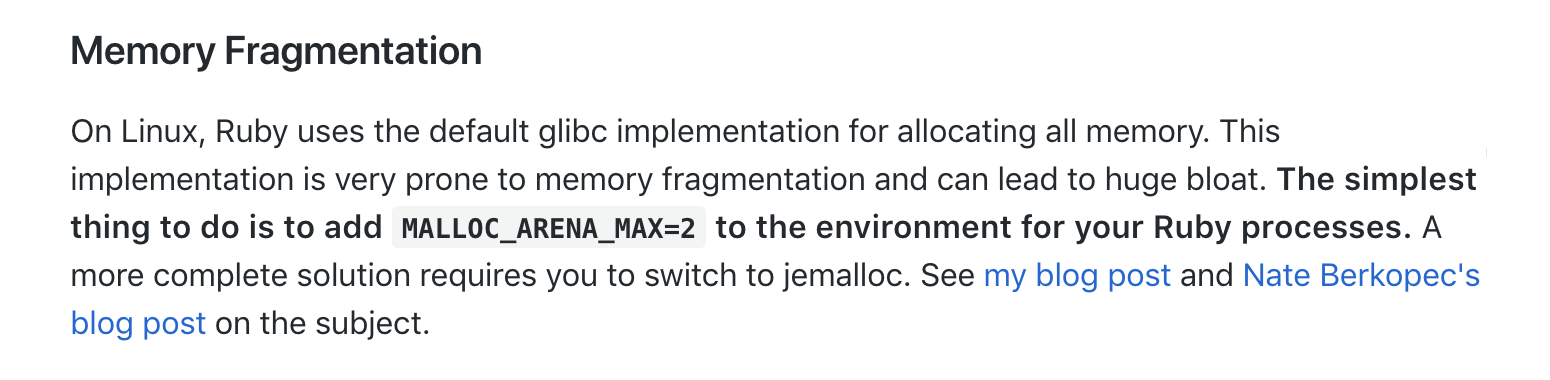
This is exactly the type of thing we’re hoping to find:
- it’s applicable, we’re using Glibc in a heavily threaded environment
- it describes a symptom that sounds a lot like what we’re seeing
- The suggested fix is trivially simple to test: we need only set an environment variable for sidekiq when starting it up.
When faced with a task like memory profiling that’s not only time consuming, but may not turn up anything, it’s always best to stop and ask yourself if there is something fast and easy you can try to confirm you’re on the right track.
Julia Evans illustrated this principle beautifully in her article titled A Small Website Mystery:
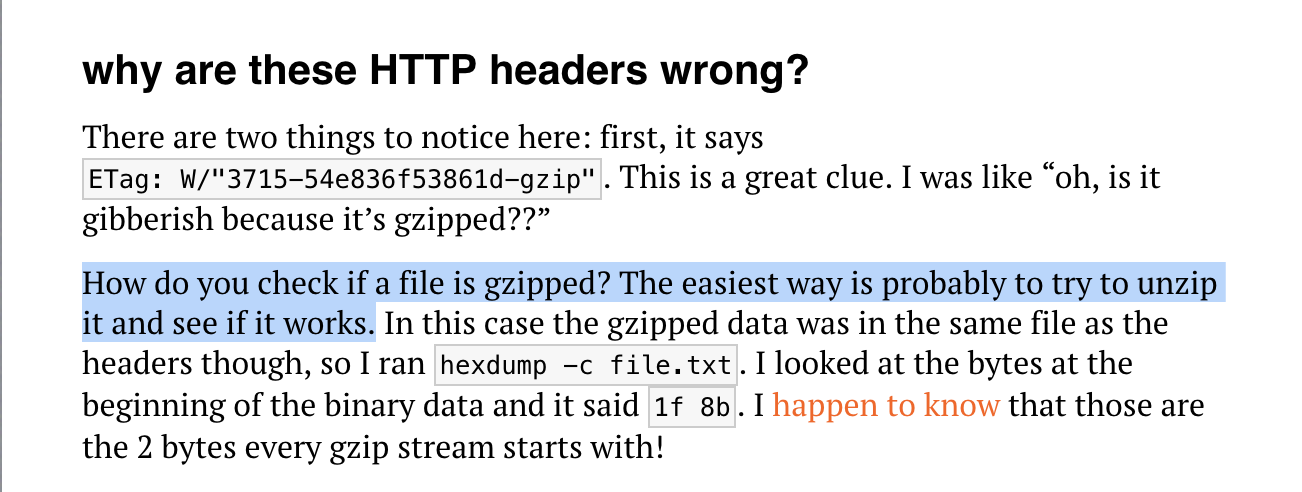
I see this often with newer developers and made this mistake myself plenty earlier in my career. Here we have a trivial change that can be made and tested in a matter of minutes. That change can rule out an entire swath of potential causes. Like a binary search, but for debugging. That’s a high-leverage option for debugging our problem. Little time or effort invested, and a large reward.
We redeployed the change with the suggested environment variable and confirmed it fixed the problem, letting us move onto more important things.